Zoho Analytics for eCommerce: Channel P&L, Inventory Turns, and Multi-Channel Reporting
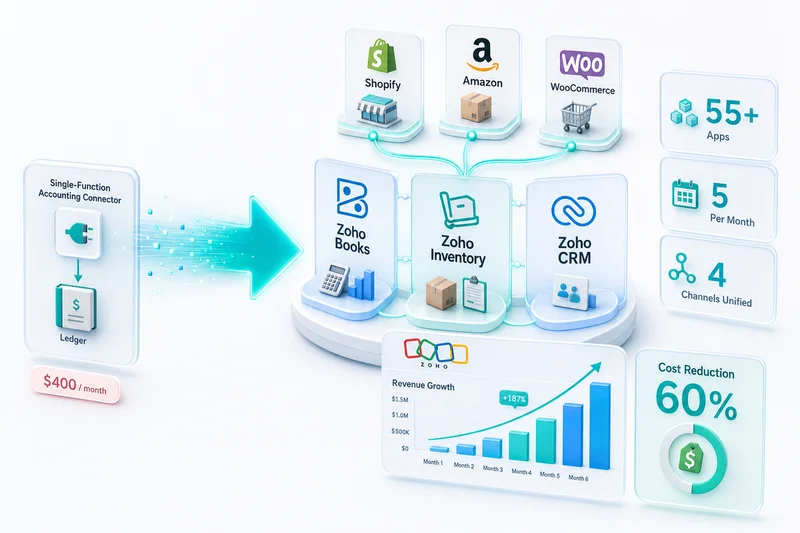
Most eCommerce sellers have more accounting data than they can use. Zoho Books records every transaction. Zoho Inventory tracks every SKU movement. Zoho CRM logs every customer interaction. The problem is not a lack of data; each system reports on its own silo. Zoho Analytics connects all three into a single reporting layer, including BFCM attribution and multi-channel revenue breakdown.
Most eCommerce sellers go into Q4 with more data than they can act on. Zoho Books records every transaction. Zoho Inventory tracks every SKU movement. Zoho CRM logs every customer interaction. The problem is not data volume. Each system reports on its own silo. Zoho Books shows accounting figures. Zoho Inventory shows stock levels. Neither tells you which channel is most profitable after fees, which SKUs are tying up cash going into BFCM, or whether your Amazon buyers actually come back.
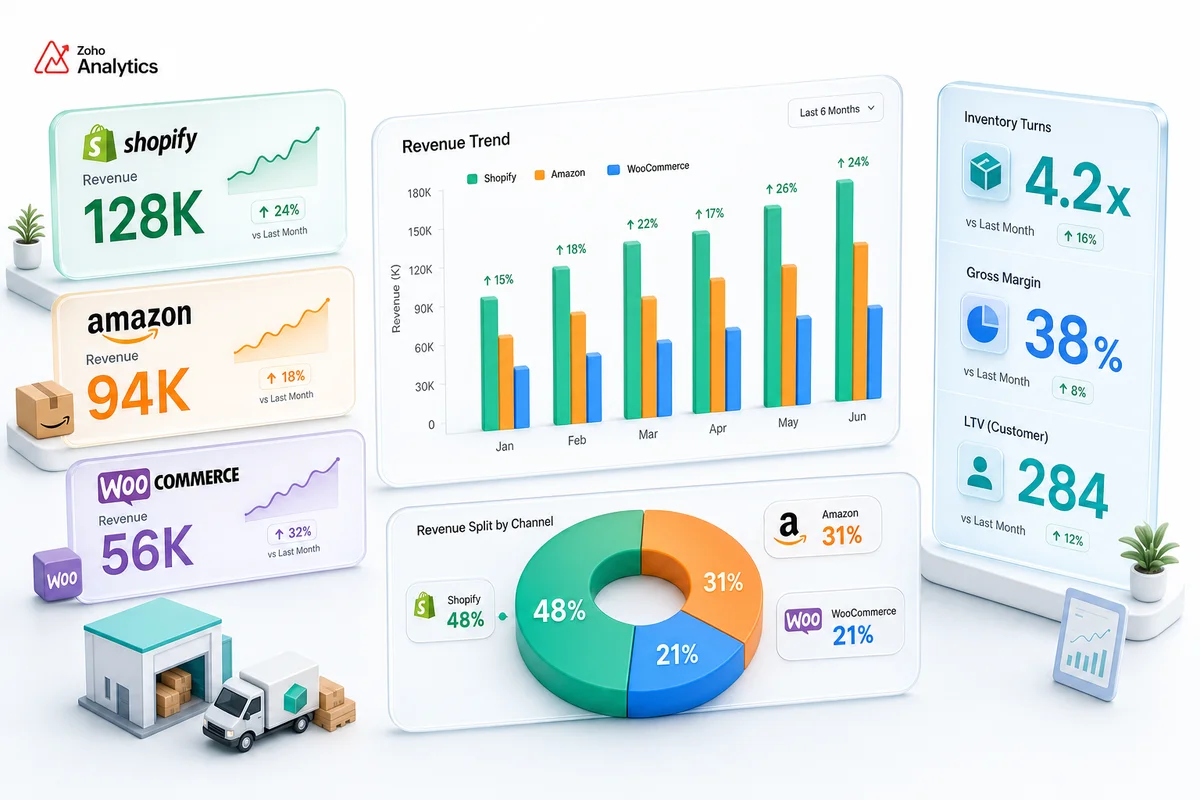
Zoho Analytics solves this by pulling data from Zoho Books, Zoho Inventory, and Zoho CRM into one reporting layer. For Shopify, Amazon, and WooCommerce sellers on the Zoho stack, it produces the cross-channel reports (BFCM attribution, multi-channel revenue breakdown) that no individual app generates on its own.
Direct answer: Zoho Analytics for eCommerce connects to Zoho Books, Zoho Inventory, and Zoho CRM to produce channel-level P&L, inventory performance analysis, BFCM multi-channel attribution, and customer lifetime value breakdowns. Setup is 1–2 weeks. As of Q4 2026, Zia Copilot adds natural language querying across joined datasets. Zoho Analytics is the reporting layer; operational alerts (reorder points, stockout warnings) stay in Zoho Inventory.
What eCommerce Sellers Actually Need from Reporting
The Reports That Drive Operating Decisions
Standard accounting reports answer historical questions: what did we sell last month, what were the costs, what is the tax liability. That is necessary. It is not sufficient for running a multi-channel eCommerce operation heading into Q4.
The reports that drive day-to-day decisions pull from multiple sources simultaneously:
- Channel P&L: Gross margin per channel after channel-specific fees, broken out by Shopify, Amazon, and WooCommerce
- BFCM attribution: Which Q4 marketing spend drove new-to-brand buyers vs reactivated customers, and what did each cohort spend over the following 90 days?
- Inventory turns: Which SKUs are moving, which are sitting, which are approaching the FBA 180-day storage fee threshold
- Customer lifetime value by acquisition source: Do Amazon customers buy again at the same rate as Shopify DTC customers?
- Sell-through rate: Percentage of opening inventory per SKU sold in a given period
- COGS as a percentage of channel revenue: Is the Amazon channel still profitable after a 15% referral fee and FBA fulfillment costs?
None of these come from a single Zoho app. They require data from Zoho Books (revenue and fees), Zoho Inventory (stock movement and COGS), and Zoho CRM (customer order history). The Zoho CRM, Books, and Inventory integration guide covers how these three apps connect at the data layer; that integration is the prerequisite before Zoho Analytics can join them for reporting.
How Zoho Analytics Connects to the eCommerce Stack
Native Connectors for Zoho Books, Inventory, and CRM
Zoho Analytics has native connectors for all three Zoho apps used in eCommerce operations. Setup involves authorizing each connector, selecting the tables to sync, setting sync frequency, and building joins between data sources. Daily sync is sufficient for reporting. Inventory-critical operations belong in Zoho Inventory. Zoho Analytics is the reporting layer.
Q4 2026 update: Zoho Analytics now includes Zia Copilot, which lets you query your joined dataset using natural language. Instead of rebuilding a report for each BFCM question like "which Amazon ASIN had the highest margin last Black Friday," Zia surfaces the answer from existing data models. It does not replace purpose-built dashboards for recurring reporting, but it handles ad-hoc questions faster than building a new pivot table.
What Each Source Contributes
| Data source | Data available in Zoho Analytics |
|---|---|
| Zoho Books | Revenue by account, fees by account, customer invoices, payments, refunds, taxes collected |
| Zoho Inventory | SKU-level stock movements, fulfilment records, POs, COGS per item, warehouse allocation by channel |
| Zoho CRM | Customer records, order history, acquisition source, revenue per customer, contact segments |
Joining Zoho Books invoice data with Zoho Inventory fulfilment data gives you revenue and COGS on the same row (the basis for per-SKU margin analysis). Joining Zoho CRM customer records with Zoho Books payment history gives you lifetime value and purchase frequency by acquisition channel.
This joining step is what makes Zoho Analytics valuable for eCommerce. Zoho Books does not know which SKU a customer bought at what cost. Zoho Inventory does not know what accounting revenue was recognized. The join produces what neither can show alone.
The Five eCommerce Dashboards to Build First
Dashboard 1: Channel P&L
The Channel P&L dashboard puts gross revenue, returns, net revenue, COGS, gross margin, and channel-specific fees in a single table, one column per channel. It pulls from Zoho Books (revenue accounts, fee expense accounts) joined with Zoho Inventory (COGS per channel fulfilment).
Key metrics per channel:
- Gross revenue
- Returns and discounts
- Net revenue
- Product COGS
- Channel fee cost (referral fees, processing fees, FBA fees)
- Gross margin %
- Net contribution margin after channel fees
In Zoho Analytics, build a pivot table with Channel as the row dimension, metric columns for each P&L line, and a date filter for period selection. Add a line chart overlay to show margin trend by month per channel.
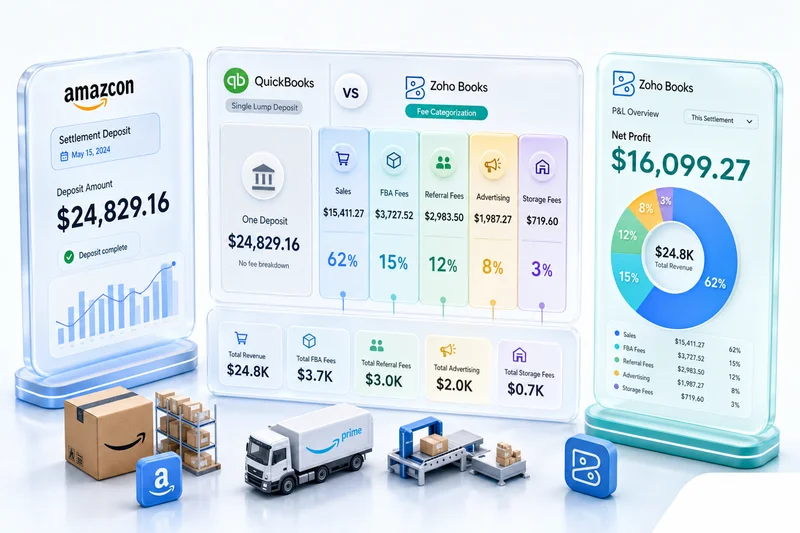
During the Black Friday to Cyber Monday window, this becomes the primary decision tool. Amazon gross margin typically runs 8–12 percentage points below Shopify DTC because of Referral Fees and FBA Fulfillment Fees, but that gap widens during BFCM when Amazon ad spend (Sponsored Products, Sponsored Brands) adds another 8–15% of revenue in advertising cost. A blended P&L hides this. The per-channel view shows it clearly:
| Channel | BFCM Net Revenue | COGS% | Channel Fees% | Advertising% | Net Margin% |
|---|---|---|---|---|---|
| Shopify DTC | $85,000 | 42% | 3% | 12% | 43% |
| Amazon FBA | $140,000 | 42% | 15% | 11% | 32% |
| WooCommerce | $28,000 | 42% | 2% | 6% | 50% |
This pattern (Amazon highest revenue, WooCommerce highest margin) is common across multi-channel sellers. Let the data decide where to put marketing dollars next BFCM season.
Prerequisite: the channel P&L report only works when Zoho Books has separate revenue and expense accounts per channel. The eCommerce chart of accounts guide covers that account structure. Tax account structure is the other prerequisite: Zoho Books needs per-state tax payable accounts for tax data to flow accurately into Analytics reports. The eCommerce sales tax accounting setup in Zoho Books covers the multi-state configuration that makes that data reliable.
Dashboard 2: Inventory Performance
The Inventory Performance dashboard shows turns by SKU, days of supply, slow movers, and FBA inventory approaching the long-term storage fee threshold. It runs off Zoho Inventory: stock levels, inbound POs, and fulfilment records.
Key metrics:
- Inventory turns (units sold in 30/60/90 days ÷ average inventory level in same period)
- Days of supply (current stock ÷ average daily sales rate)
- Slow movers: SKUs with fewer than one turn per 90 days
- FBA at-risk inventory: units at Amazon FBA with more than 150 days of supply (approaching the 180-day long-term storage fee threshold)
Amazon's long-term storage fees start at 180 days and escalate significantly after 270 days. For a seller with 300+ SKUs, this report identifies specific items driving storage fees before the quarterly charge arrives. For BFCM planning specifically, days of supply on your top 20 SKUs tells you exactly how many units to send FBA before Black Friday without over-sending into post-holiday slow velocity. The BFCM inventory planning guide for Shopify and Amazon sellers covers how to use this data to set FBA send quantities by SKU.
For sellers who already use Zoho Inventory's built-in reorder point alerts, the Zoho Inventory reorder points guide covers how to configure those triggers. The Zoho Analytics inventory dashboard provides the trend and historical view that Zoho Inventory's operational alerts do not.
Dashboard 3: Customer Lifetime Value by Channel
The Customer LTV dashboard tracks average order value, purchase frequency, and estimated lifetime value per acquisition channel. Data comes from Zoho CRM (customer records, acquisition source) joined with Zoho Books (invoice payment history per customer).
Key metrics:
- Average order value by channel (Shopify DTC vs Amazon vs WooCommerce)
- Purchase frequency within 12 months
- Estimated 3-year LTV by customer segment
- 90-day cohort retention: what percentage of first-time buyers made a second purchase within 90 days
The most valuable time to run this dashboard is January, after BFCM. BFCM acquires large cohorts of first-time buyers (some genuine brand fits, most price-driven). The 90-day retention rate distinguishes them. Shopify DTC buyers from BFCM tend toward 25–35% 90-day repeat purchase rates when they receive post-purchase lifecycle flows. Amazon BFCM buyers have no direct brand relationship and typically return to Amazon for their next purchase. This dashboard puts that LTV gap in dollar terms. It usually justifies the higher Shopify DTC customer acquisition cost. For the post-BFCM retention automation layer, the eCommerce customer retention guide with Zoho CRM covers the segment and workflow setup that converts BFCM first-timers into repeat buyers.
Amazon customers have no direct post-purchase relationship with your brand unless you have a specific touch point (insert cards, subscription enrollment, off-platform follow-up). Shopify DTC customers enter your CRM and receive lifecycle emails, SMS, and retargeting. This report quantifies the LTV difference in dollar terms so you can calculate whether DTC customer acquisition costs are justified by the higher LTV.
Dashboard 4: Margin by SKU and Product Category
The Margin by SKU dashboard shows gross margin per product and category, including COGS and the channel fees attributable to each product. Data joins Zoho Inventory (per-SKU COGS) with Zoho Books (revenue by product and channel fees).
Key metrics:
- Gross margin % by product
- Revenue contribution by product (the 20% of SKUs driving 80% of revenue)
- Products where margin has declined vs prior period (usually signals a fee increase or supplier cost change)
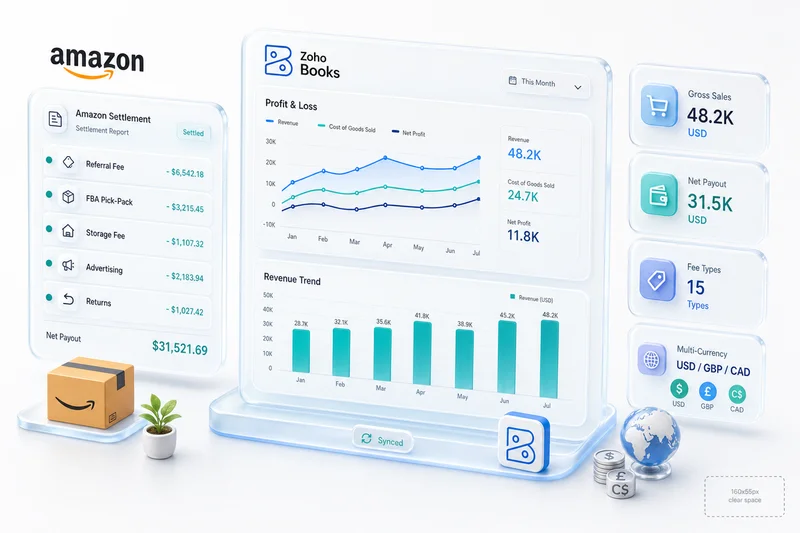
This report answers a question that is obvious in principle but invisible without per-SKU data: which products to cut, which to push, and where margin compression is hiding. For Amazon sellers, FBA fee increases and supplier cost changes show up here first, before they surface in the blended P&L. The Amazon accounting with Zoho Books guide covers how to structure Amazon-specific fee accounts so this data feeds correctly into Analytics.
Get Your eCommerce Analytics Set Up
BFCM Attribution: Measuring Multi-Channel Campaign ROI
BFCM is the highest-revenue period for most eCommerce sellers and the most analytically confusing. Multiple campaigns run simultaneously across Shopify (Meta, Google), Amazon (Sponsored Products, DSP), and WooCommerce. Revenue spikes. Fees spike. COGS spikes. Without a BFCM attribution dashboard, the question "which channel had the best Q4 ROI" goes unanswered until March, when the decisions that should have followed it are long past.
Build a BFCM attribution view in Zoho Analytics:
- Date-range filter: November 28 through December 2 (BFCM week), compared to the prior 4-week baseline
- Channel dimension: Shopify, Amazon, WooCommerce as separate rows
- Buyer segment dimension: New-to-brand vs returning (use the CRM first-order date to classify)
- Metrics: Revenue, COGS, channel fees, advertising spend (from expense accounts in Zoho Books), net margin, and 90-day repeat purchase rate per cohort
This tells you whether your BFCM spend acquired profitable new-to-brand buyers or discounted to existing customers who would have purchased anyway. If 80% of Amazon BFCM revenue came from returning buyers at a 15% discount, the campaign destroyed margin on customers who were already yours. If 60% of Shopify DTC BFCM revenue was new-to-brand and 30% of those buyers purchased again within 90 days, the campaign built long-term revenue. Those are opposite conclusions from similar top-line numbers.
Zoho Analytics' Zia Copilot can query this view in natural language after setup: "Show me new-to-brand buyers from BFCM by channel with their 90-day revenue" pulls the answer without rebuilding a report each time.
Zoho Analytics vs Standalone BI Tools for eCommerce
Sellers on the Zoho stack face a choice when it comes to reporting: Zoho Analytics (included in Zoho One, or available as a standalone subscription) or exporting data to a dedicated BI tool like Tableau, Looker, or Power BI.
For sellers already on Zoho Books and Zoho Inventory, Zoho Analytics is the faster path. Native connectors eliminate the data pipeline work that standalone BI tools require. The tradeoff: Zoho Analytics has less visualization flexibility than dedicated BI tools and fewer advanced statistical functions.
For most eCommerce operations under $10M annual revenue, Zoho Analytics covers all five dashboards above. Two Q4 2026 additions narrow that gap further: Zia Copilot (natural language querying across joined datasets) and improved AI anomaly detection, which flags revenue or margin spikes during high-velocity BFCM periods without threshold setup.
Sellers scaling beyond $10M should evaluate whether their reporting complexity outgrows what Zoho Analytics handles natively. At that point, the investment in a dedicated BI layer plus a data pipeline is typically justified.
Zoho Analytics' official eCommerce reporting documentation covers the platform capabilities. The dashboards above are eCommerce-specific implementations built on top of those platform capabilities.
The general Zoho Analytics setup guide covers platform configuration for non-eCommerce use cases. The eCommerce dashboards above require the eCommerce-specific data joins and channel account structure described in this guide.
Implementation: What Setup Involves
Data Source Connection and Join Design
Connecting Zoho Books, Zoho Inventory, and Zoho CRM to Zoho Analytics takes a few hours. The time is in designing the joins between sources and building the calculated fields that produce the metrics above.
Key calculated fields to build:
- Gross margin % = (Net Revenue - Product COGS) / Net Revenue × 100
- Inventory turns = COGS for period ÷ average inventory value for period
- Days of supply = current stock units ÷ average daily sales rate (30-day rolling)
- Customer LTV (3yr estimated) = average order value × average annual order frequency × 3
- BFCM new-to-brand % = new customers in BFCM window ÷ total BFCM customers × 100
Join design decisions:
- Link Zoho Books invoice line items to Zoho Inventory item records by SKU to enable per-product margin analysis
- Link Zoho CRM contact records to Zoho Books customer records by email or customer ID for LTV reporting
- Link Zoho Inventory fulfilment records to Zoho Books invoices by order number for COGS-per-order analysis
The full setup takes 1–2 weeks as part of a multi-channel Zoho implementation. For BFCM reporting, complete it before Black Friday. Post-event attribution is possible but requires backfilling data that was never captured in the right structure.
Zolify's eCommerce Analytics Track Record
Across 100+ eCommerce implementations, Zolify includes Zoho Analytics reporting as part of every Zoho One and full-stack deployment. The reporting layer is what makes the Zoho Books and Zoho Inventory setup visible in business terms: gross margin by channel, inventory health by SKU, customer value by acquisition source, and increasingly, BFCM attribution analysis for Q4 planning decisions.
For the channel P&L dashboard to work correctly, the foundation must be in place: separate revenue accounts per channel in Zoho Books, COGS posting from Zoho Inventory, and channel-specific fee expense accounts. For the full step-by-step channel P&L dashboard build in Zoho Analytics (fee normalization tables, COGS allocation joins, and gross margin by Shopify, Amazon, and eBay) see the Zoho Analytics dashboard setup guide. The Zoho for eCommerce platform guide covers how all four Zoho eCommerce apps connect at the platform level. Zoho Analytics is the reporting layer on top of that operational foundation. For the specific KPI calculation layer (CAC, LTV, COGS%, and contribution margin by channel) see the Zoho Analytics dashboards guide. For the AI-powered layer (Zia natural language queries, demand forecasting, and anomaly detection) see How AI Is Changing eCommerce Operations in 2026.
As an Official Zoho Authorized Partner with a Chartered Accountant on staff, Zolify configures the data model, joins, and dashboards for your specific channel mix: Shopify and Amazon only, or the full five-channel setup including WooCommerce, eBay, and Etsy.
Get Multi-Channel Visibility on Your eCommerce Operations
Running Shopify, Amazon, and WooCommerce without a unified view of channel profitability and inventory performance means making restocking and marketing decisions with incomplete data. Zoho Analytics on top of your existing Zoho Books and Zoho Inventory stack takes 1–2 weeks to configure. With Q4 approaching, that window is short.
Get an eCommerce Analytics Review to review your current reporting setup and identify which dashboards (channel P&L, BFCM attribution, inventory performance) would deliver the most immediate value for your channel mix.
Frequently Asked Questions
Zoho Books is an accounting system; it records transactions and generates standard financial reports. What it does not do is join accounting data with inventory movement and customer data into a single report. Zoho Analytics adds that cross-source layer. With connectors to Zoho Books, Zoho Inventory, and Zoho CRM, you get per-channel P&L by Shopify vs Amazon vs WooCommerce, inventory performance reports covering turns and days of supply, customer lifetime value by acquisition channel, and BFCM attribution analysis showing which Q4 campaigns drove profitable repeat buyers vs one-time buyers. These reports cannot be generated from Zoho Books alone.
Zoho Analytics has native connectors for Zoho Books, Zoho Inventory, and Zoho CRM. Setup involves authorizing each connector, selecting the tables to sync (transactions, items, contacts, invoices, fulfilments) and setting sync frequency. Daily sync handles most eCommerce reporting needs. Once active, you build joins between data sources: Zoho Books invoice data joined with Zoho Inventory item data produces revenue and COGS on the same row. The Q4 2026 Zia Copilot feature in Zoho Analytics lets you query these joined datasets using natural language, useful for ad-hoc BFCM analysis without rebuilding a report each time.
Yes, when the chart of accounts in Zoho Books has separate revenue and expense accounts per channel. With Shopify Sales, Amazon Sales, and WooCommerce Sales as separate accounts (and channel-specific fee expense accounts), Zoho Analytics produces a pivot showing gross revenue, COGS, channel fees, and net contribution margin side by side. During BFCM, this report is particularly valuable: Amazon Referral Fees rise on high-velocity SKUs, Shopify ad spend spikes, and the per-channel margin story often looks very different from the blended P&L your accountant sees.
Inventory turnover measures how many times your average inventory sells through in a given period. Formula: Cost of Goods Sold ÷ Average Inventory Value. In Zoho Analytics connected to Zoho Inventory, this joins fulfilment COGS data with average stock value over the same period. A turnover of 4 means the average inventory sells through four times per year (a 90-day holding period). For Amazon FBA sellers, turns below 2 per year signal at-risk inventory approaching the 180-day long-term storage fee threshold. In Q4, the inverse problem appears: sellers who planned BFCM inventory correctly often face post-BFCM low-velocity carry into January. This report surfaces that exposure too.
Connecting data sources and building the five core dashboards (channel P&L, inventory performance, customer lifetime value, SKU margin, and BFCM attribution) takes 1–2 weeks as part of a full Zoho eCommerce implementation. Data source connections take a few hours; the time is in join design, calculated fields, and dashboard layout for your specific channel mix. For sellers adding Zoho Analytics to an existing Zoho Books and Inventory setup, the core reports can be live in 1–2 weeks. If you want BFCM attribution data from this year's campaign, complete the setup before Black Friday. Not after.
See exactly where your Shopify, Amazon, or WooCommerce ops are leaking — free.
Get a personalised eCommerce Ops Audit: inventory gaps, accounting leaks, and order-flow bottlenecks — with a Zoho fix roadmap. Delivered in 48 hours, at no cost.