Skip to content
Analytics & Reporting

If You Can't Measure It, You Can't Fix It

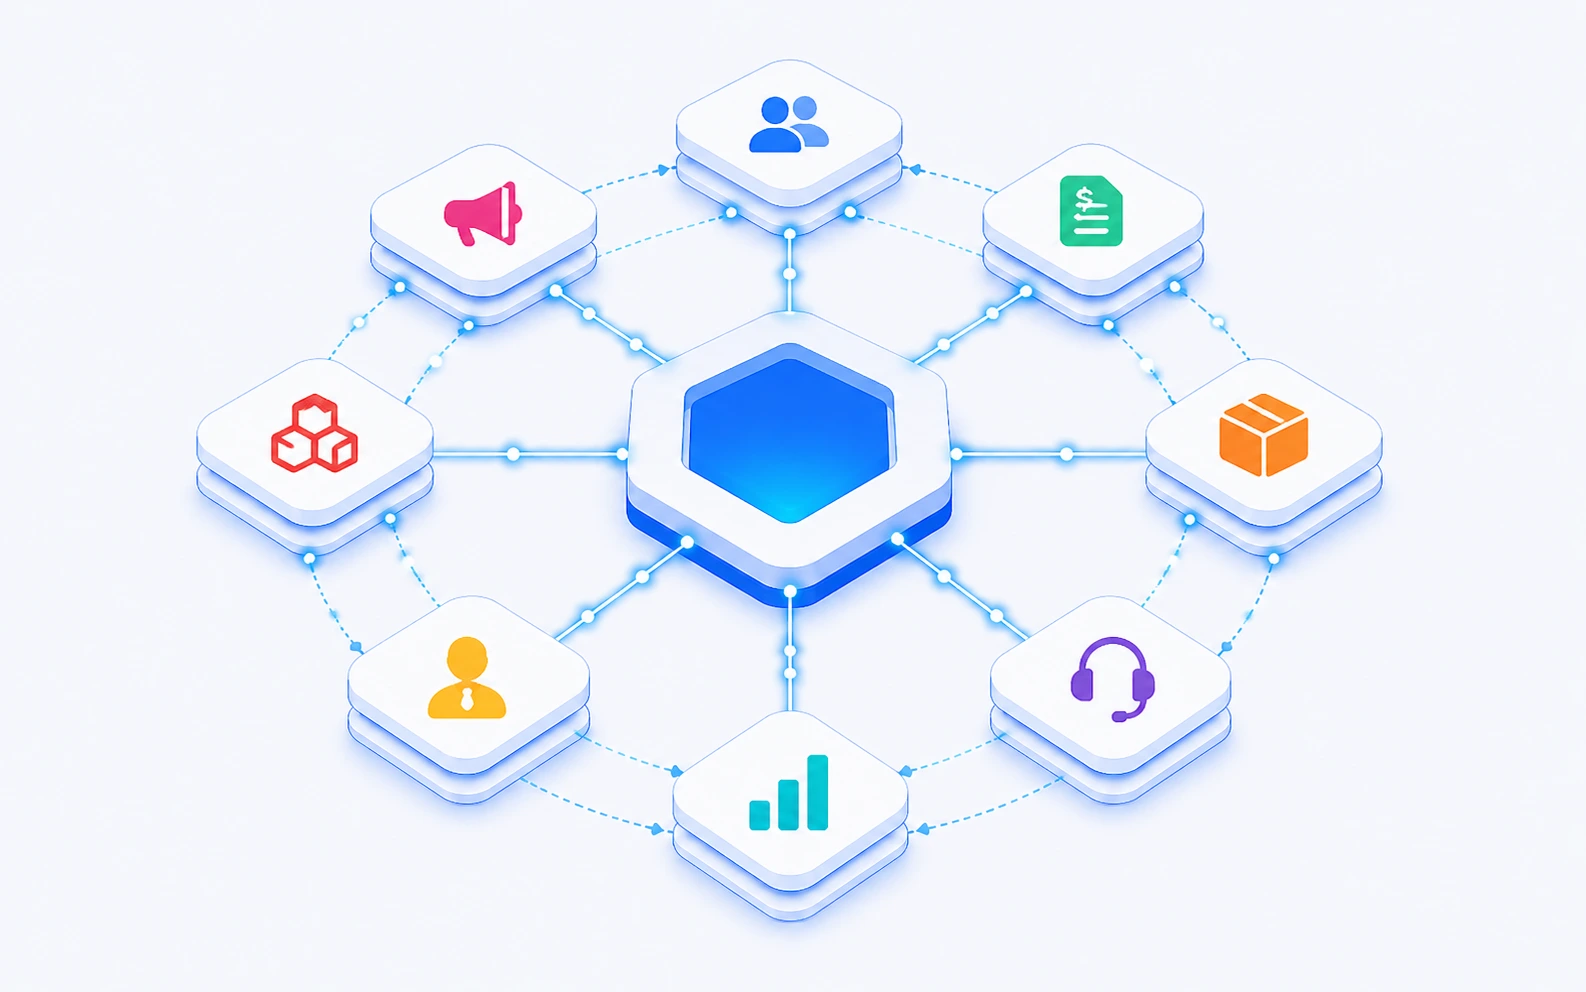
Only 27% of brands track contribution profit. 73% don't trust their attribution models. Your data lives in 17-20 separate platforms. By the time you export CSVs and build a spreadsheet, the numbers are already stale. We build real-time dashboards that tell you exactly where you're making and losing money.

Only 27%of brands track contribution profit
73%don't trust their attribution models
17-20platforms in average martech stack
Get Real-Time Visibility Into Your Business

Sound Familiar?

Your Data Lives in 20 Silos

The average martech stack runs 17-20 platforms and none of them speak the same language. 65.7% of data leaders say integration is the number-one barrier to useful analytics. You end up toggling between tabs, hoping the numbers line up.

Reports Are Outdated Before They're Ready

Export CSVs, combine spreadsheets, fix broken formulas. By the time the report reaches anyone who can act on it, the data is already stale. Weekly reports describe last week's problems, not today's opportunities.

You Don't Know Which Channel Is Actually Profitable

Only 27% of brands track contribution profit. Attribution models can't account for margins, returns, shipping, or lifetime value. The brands that do track it achieve 43% higher marketing efficiency than those flying blind.

51% of CTOs Don't Trust Their Data

Inconsistent numbers across platforms. Conflicting dashboards. Nobody knows which number is right, so decisions default to gut feel. When leadership doesn't trust the data, it stops mattering.

What We Do for You

We Build Channel P&L Dashboards

Actual profitability per channel after ALL costs: ad spend, platform fees, shipping, returns, COGS. See exactly which channels make money and which ones burn it.

Channel P&L dashboard comparing revenue and costs by marketplace

We Create Product Margin Analysis

Per-product profitability including COGS, marketplace fees, returns, advertising allocation, and fulfillment. Know which SKUs to scale and which to kill.

Product profitability analysis with margin breakdown

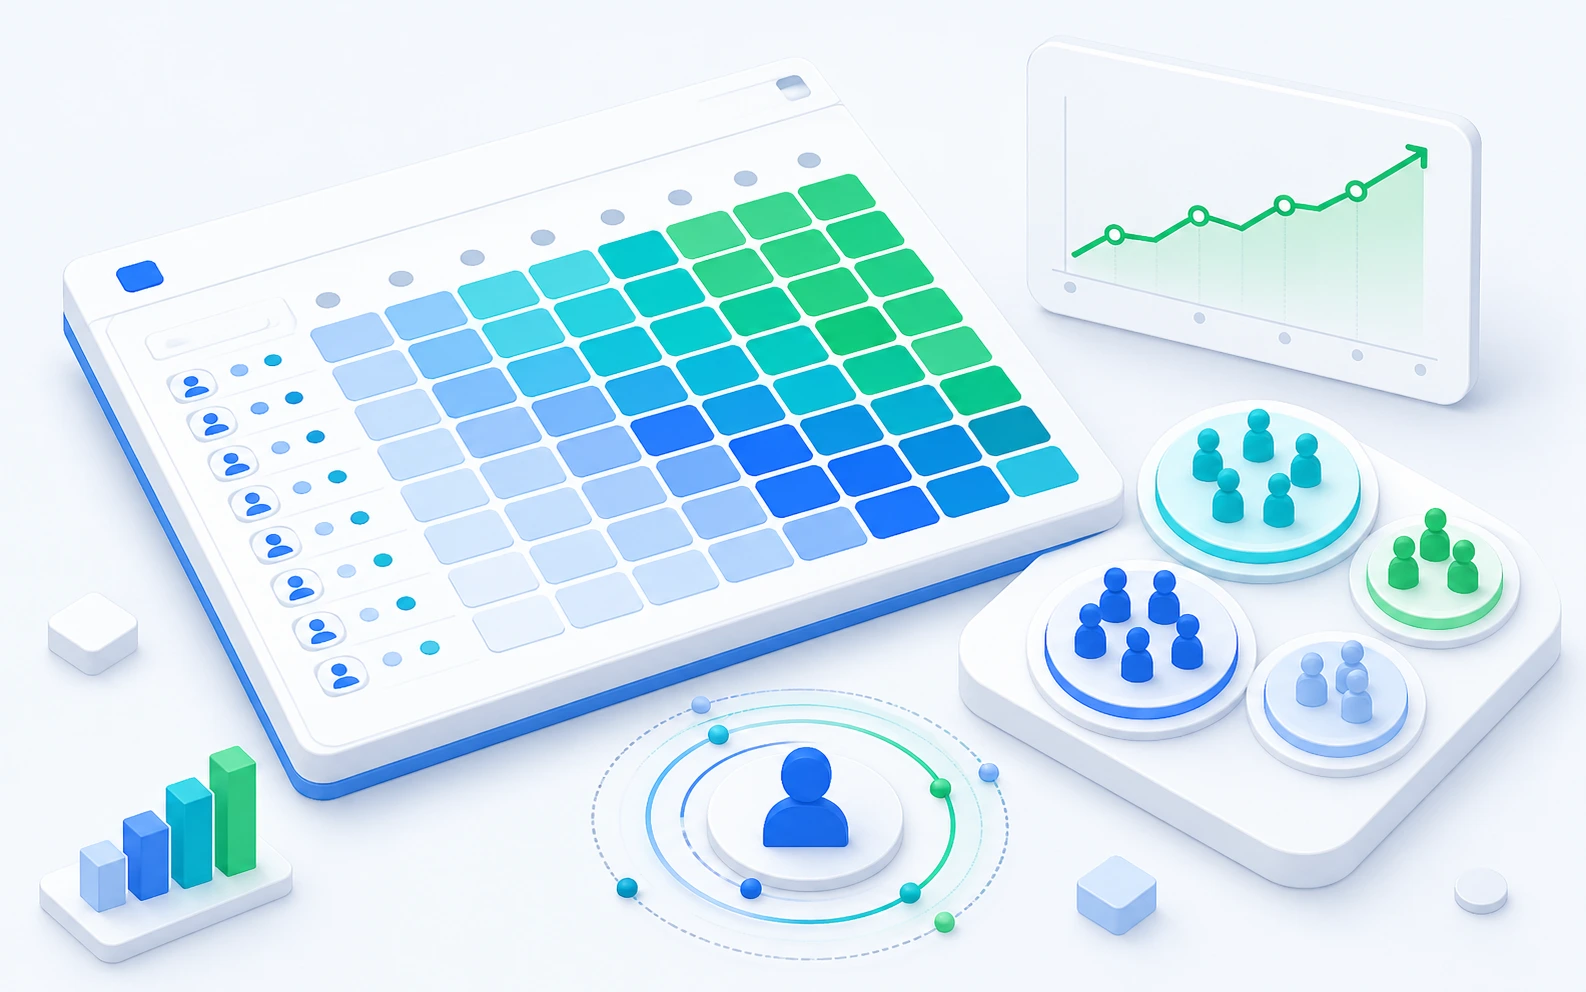
We Set Up Customer Analytics

Lifetime value, customer acquisition cost, cohort analysis, retention rates, and repeat purchase tracking. Understand who your best customers are and how to find more of them.

Customer cohort and retention analysis heatmap

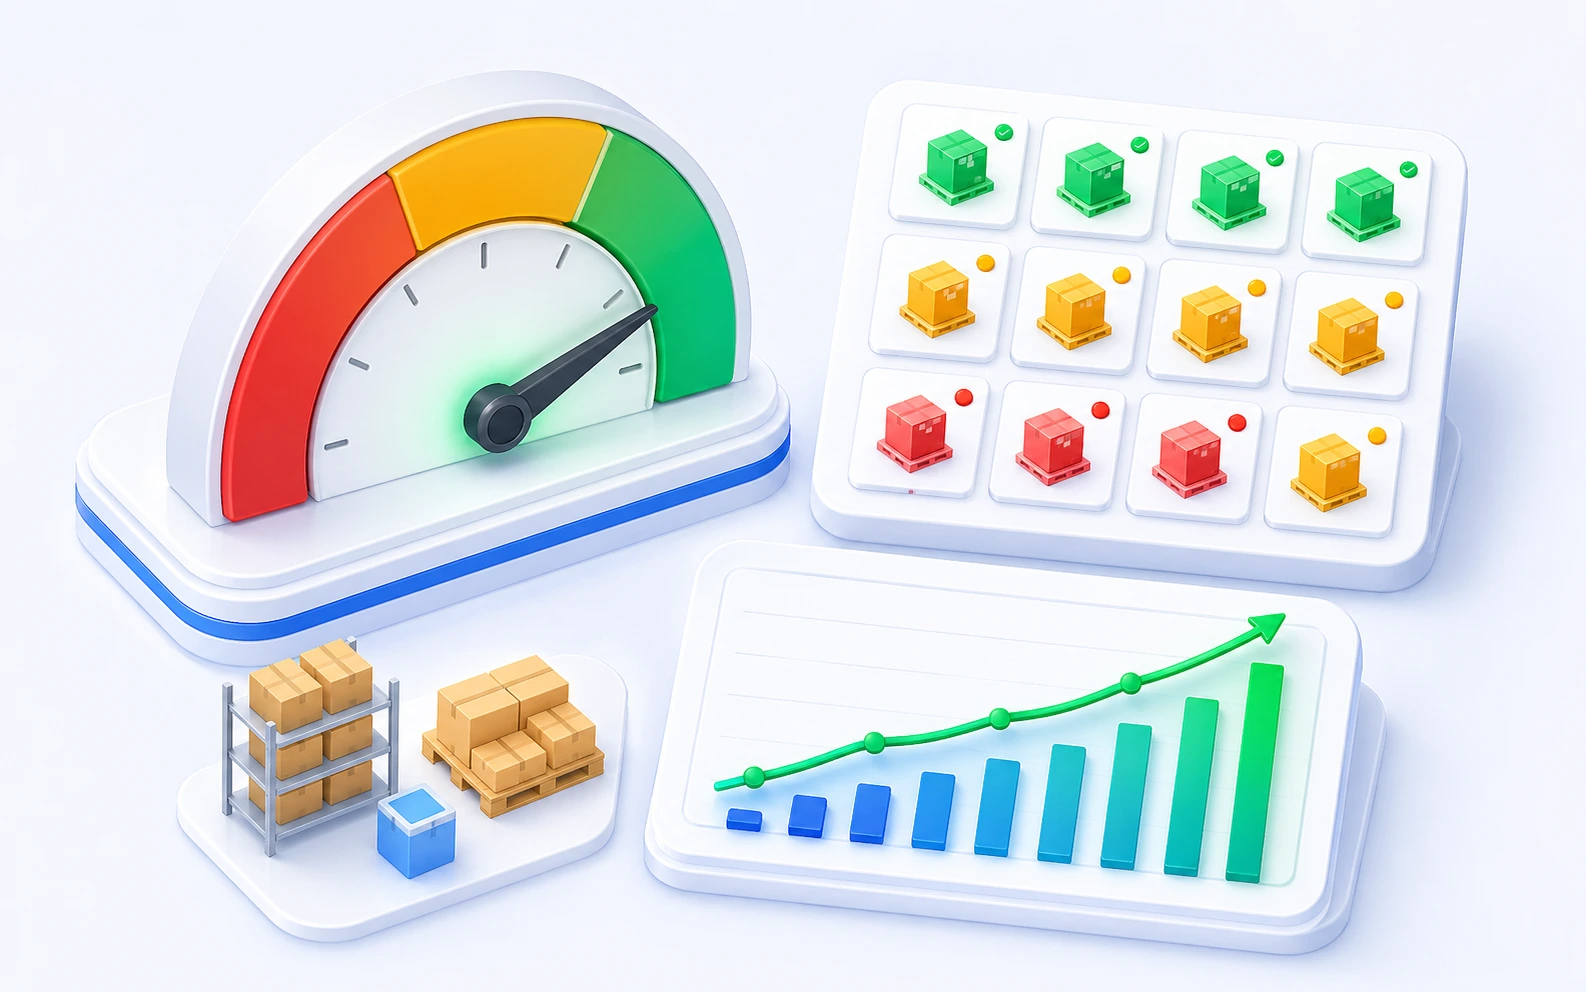
We Build Inventory Health Reports

Stock turnover rates, aging analysis, dead stock alerts, and demand pattern recognition. Stop tying up cash in products that sit on shelves.

Inventory health monitoring gauge with stock status grid

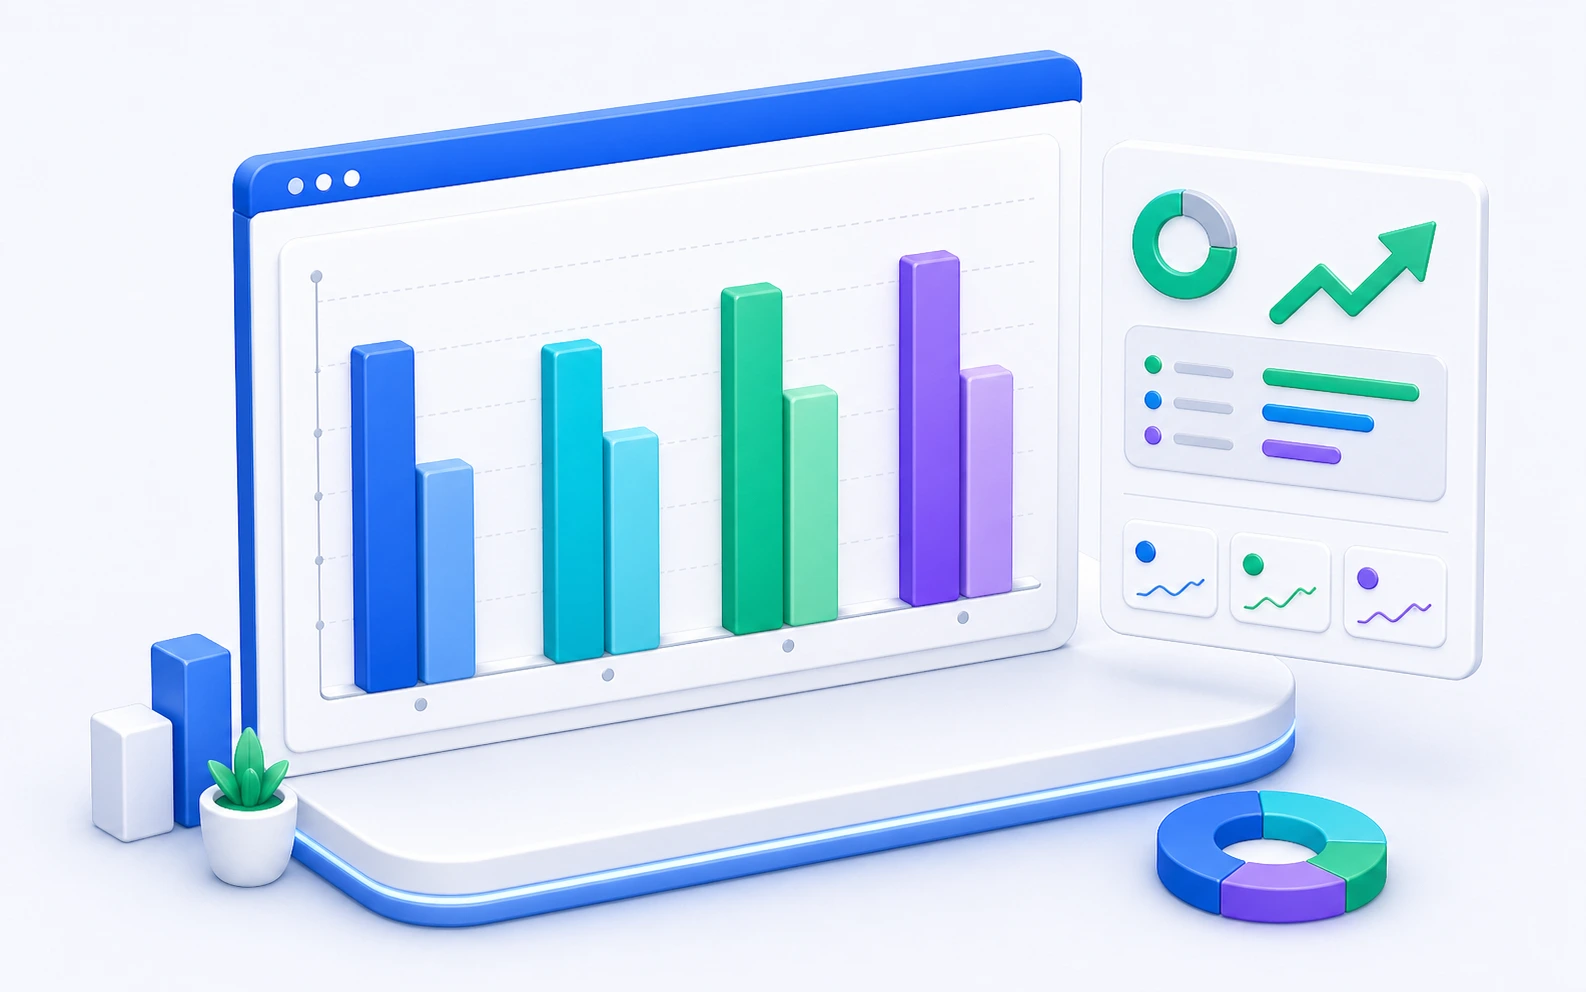
We Create Marketing ROI Tracking

Campaign performance tied to actual revenue, not vanity metrics. See true ROAS, blended CAC, and marketing efficiency ratio across every channel.

Marketing ROI tracking with spending vs revenue trend lines

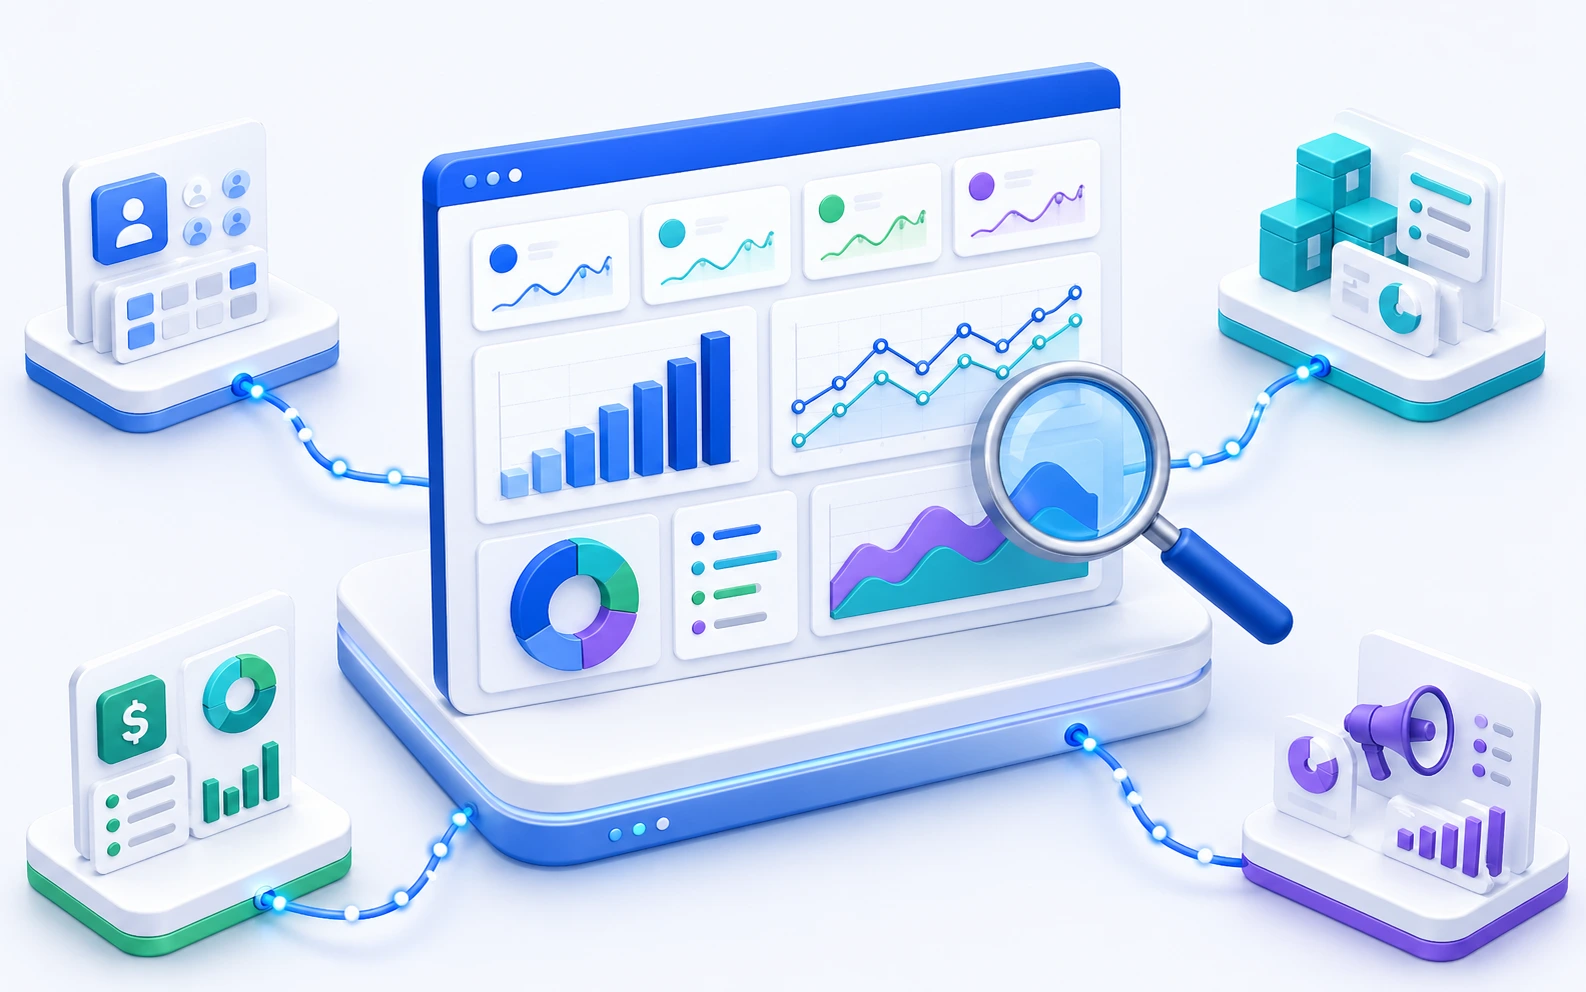
We Design Executive Dashboards

One screen showing your entire business for founders and CEOs. Revenue, margins, cash flow, inventory health, and marketing performance, updated in real time.

Executive KPI dashboard with sparklines and performance metrics

How We Work

STEP 01

Data Audit

We map every data source you use: sales channels, marketing platforms, accounting, inventory, CRM, and identify gaps, duplicates, and inconsistencies.

STEP 02

Dashboard Design

We design dashboard wireframes with you, defining the exact KPIs, views, and drill-downs your team needs to make faster decisions.

STEP 03

Build & Connect

We build the dashboards in Zoho Analytics, connect every data source, set up automated syncs, and validate numbers against your existing records.

STEP 04

Iterate & Expand

Once the core dashboards are live, we iterate based on feedback, add new views as your business evolves, and train your team to self-serve.

Built on Zoho

Zoho ecosystem, CRM, Inventory, Books, Analytics connected natively

Results

0%higher marketing efficiency with profit tracking
Real-timedashboards replacing weekly spreadsheets
Singlesource of truth across all channels
0+implementations delivered

Common Questions

We connect Shopify, Amazon, WooCommerce, eBay, Etsy, Google Ads, Meta Ads, QuickBooks, Xero, Zoho Books, shipping platforms, and virtually any tool with an API or data export. If your data exists somewhere, we can pull it into your dashboards.

Yes. Every dashboard is built around the metrics that matter to your business. We start with a design phase where we define your exact KPIs, views, and drill-down paths before writing a single formula.

Zoho Analytics offers enterprise-grade BI at a fraction of the cost of Tableau or Looker. It connects natively with the entire Zoho ecosystem, supports custom SQL, handles millions of rows, and includes AI-powered insights. For eCommerce businesses running on Zoho, it is the natural choice.

A core set of dashboards (channel P&L, product margins, and executive overview) typically takes 3-4 weeks. More complex implementations with customer analytics, inventory health, and marketing attribution run 6-8 weeks depending on data source complexity.

Pricing depends on the number of data sources, dashboards, and complexity of the calculations. We provide a fixed-scope quote after the data audit so there are no surprises. Most implementations fall between $3,000 and $15,000.

Yes. Businesses evolve, and dashboards need to evolve with them. We offer monthly retainer plans that cover new dashboard builds, data source additions, formula updates, and team training.

Ready to Make Decisions With Data, Not Guesswork?

Book a free consultation. We will audit your data sources and show you exactly what a real-time dashboard can do for your business.

Let's Talk
Explore all solutions