Zoho Analytics Dashboards: 5 Reports Business Owners Actually Use
Most analytics dashboards show data nobody acts on. Here's how to configure Zoho Analytics with the 5 dashboards business owners actually use to make decisions — built from 100+ real implementations.
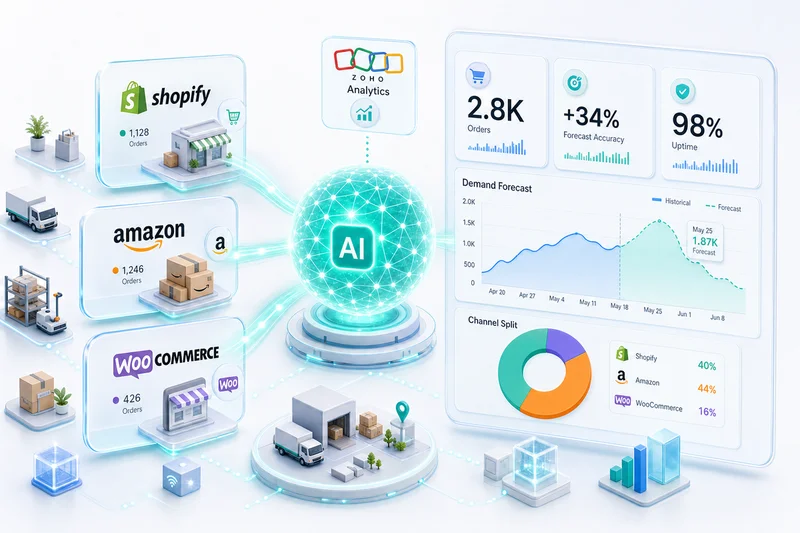
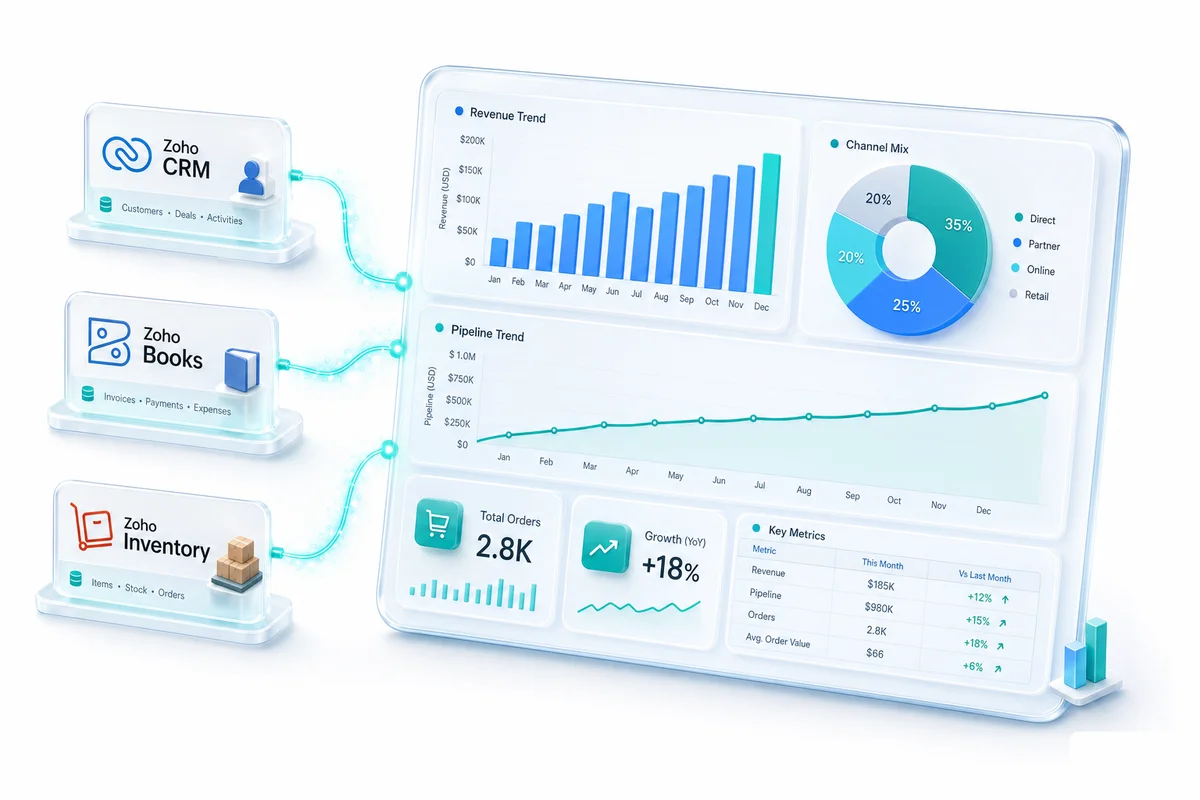
Zoho Analytics is a business intelligence platform that connects your Zoho apps — CRM, Books, Inventory, Desk, Projects — into unified dashboards that update automatically. Most businesses have the data. The problem is it's scattered: CRM shows pipeline, Books shows financials, Inventory shows stock. None of them talk to each other natively. Zoho Analytics is the layer that joins them.
The short answer to "does it work?" is yes, but only if you build the right dashboards. Most implementations go wrong at this step: too many charts, wrong metrics, dashboards nobody opens after week two.
Here are the 5 dashboards that actually get used, based on 100+ implementations across eCommerce, professional services, and distribution businesses. Each one answers a specific question. If a chart on your dashboard doesn't change a decision, it shouldn't be there.
Zoho Analytics vs the reports already in your Zoho apps
Before building dedicated Analytics dashboards, it helps to know what you're getting beyond what's already in your Zoho apps.
| Feature | Reports in Zoho CRM / Books / Inventory | Zoho Analytics dashboards |
|---|---|---|
| Data scope | Single app only | Cross-app (CRM + Books + Inventory + Desk + external) |
| Customisation | Limited to pre-built templates | Fully custom — any field, any chart type |
| Calculated metrics | Basic (e.g. deal count, invoice total) | Advanced (LTV, CAC, blended margin, inventory turns) |
| Scheduled distribution | Per-app only | Unified — one scheduled report across all sources |
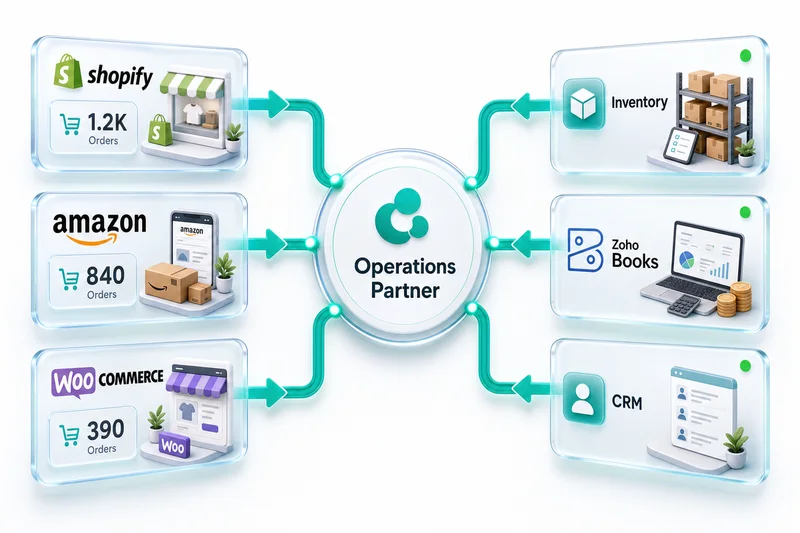
| External data | Not supported | Google Sheets, Shopify, Amazon, WooCommerce, SQL, REST API |
| Embedded sharing | Not available | Embeddable in client portals, websites |
If your decisions require only CRM data (pipeline, deal activity), stay with CRM's built-in reports — they're fast and good enough. When you need to correlate sales with cash flow, or inventory with order fulfilment, that's when Analytics earns its cost.
Dashboard 1: Revenue and financial health
Question it answers: "How's the business doing financially, right now?"
This dashboard pulls from Zoho Books and shows:
Revenue trend. Monthly revenue for the last 12 months with year-over-year comparison. Not just total revenue — broken down by product line, service type, or channel. For eCommerce businesses, this means revenue per marketplace: Shopify, Amazon, WooCommerce, eBay.
Gross margin. Revenue minus COGS, shown as a percentage trending over time. A declining margin trend is the earliest warning sign of pricing or cost problems. Most business owners only see this at quarterly reviews with their accountant. When you have a CA/CPA reviewing your books monthly, this dashboard becomes the conversation starter, not the whole conversation.
Accounts receivable aging. Open invoices grouped by 0–30 days, 31–60 days, 61–90 days, 90+ days. When the 90+ bucket grows, cash flow problems follow 2–3 months later. Seeing it in real time lets you act before it hurts. For sellers managing AP automation through Zoho Books, the AR dashboard is the counterpart — cash in versus cash out, both visible in one place.
Cash flow forecast. Expected inflows (outstanding invoices by due date) minus expected outflows (upcoming bills, recurring expenses). A 30–60 day forward view that tells you whether you need to collect faster, delay purchases, or draw on a credit line.
Monthly close status. For businesses using our managed accounting service, a visual tracker showing which reconciliation steps are complete for the current month.
This dashboard replaces the monthly P&L that arrives 2–3 weeks after month-end. The data is the same, but it's current, not historical.
Dashboard 2: Sales pipeline and forecast
Question it answers: "What's coming in, and can I trust the forecast?"
Pulls from Zoho CRM:
Pipeline by stage. Total deal value at each pipeline stage, colour-coded by health. Deals sitting in a stage too long get flagged. A healthy pipeline has consistent flow through stages; a bottleneck at "Proposal Sent" means something's wrong with your proposals or your pricing.
Weighted forecast. Deal values multiplied by stage probability, giving a realistic expected revenue for the next 30/60/90 days. This is the number you use for hiring, inventory purchasing, and cash flow planning — not the optimistic "total pipeline" figure.
Win rate trends. Monthly win rate (closed won / total closed) over the last 12 months. A declining win rate requires investigation. Combined with close-reason data, you'll see whether you're losing on price, features, timing, or a specific competitor.
Sales velocity. Average days from lead creation to deal close. If velocity is increasing, deals are getting harder to close — something changed in the market or your process.
Rep activity and performance. Calls, emails, meetings, and deals per rep. Not for micromanagement, but for spotting who needs support and who has capacity for more leads.
Dashboard 3: Inventory and operations (eCommerce)
Question it answers: "Am I going to stock out, overstock, or miss a fulfilment?"
Pulls from Zoho Inventory and connects with inventory management solutions:
Stock levels by SKU. Current quantity, reorder point, days of supply remaining. SKUs approaching reorder point get flagged. SKUs with 90+ days of supply get flagged differently — that's tied-up capital.
Channel-by-channel inventory. For multi-channel sellers, see stock allocated per channel (Shopify, Amazon FBA, warehouse) and total available. This prevents the classic problem: sold out on Amazon while 200 units sit allocated to Shopify. For sellers running Q4 inventory planning, this dashboard becomes critical in October and November when stockout risk is highest.
Fulfilment rate. Percentage of orders shipped within SLA (same-day, next-day, whatever your commitment is). When this drops below 95%, customer satisfaction follows within 2–3 weeks. The dashboard shows the trend and identifies the bottleneck — out of stock, warehouse delay, or carrier issue.
Inventory turnover. How fast you're selling through stock, by SKU and by category. Low-turnover SKUs are candidates for clearance or discontinuation. High-turnover SKUs need more aggressive reorder quantities.
Dashboard 4: Customer support health
Question it answers: "Are our customers happy, and where are they struggling?"
Pulls from Zoho Desk and CRM:
Ticket volume trend. Total support tickets over time, by category. A spike in tickets on the same topic signals a product issue, a documentation gap, or an onboarding problem.
Resolution time. Average time from ticket creation to resolution, by priority and by agent. When resolution time creeps up, the team is either overloaded or the issues are getting more complex.
Customer satisfaction (CSAT). Post-ticket satisfaction scores, trended over time. This is the clearest signal of whether your support operation is working.
Tickets by account tier. Connected to CRM data, this shows whether your highest-value customers are getting the fastest resolution. If your biggest accounts have the longest wait times, that's a retention risk worth addressing before renewal season.
This dashboard is particularly useful for businesses running integrated customer support and CRM setups where support history needs to inform sales follow-up.
Dashboard 5: Team productivity and utilisation
Question it answers: "Is the team working on the right things, and do we have enough capacity?"
Pulls from Zoho Projects and CRM:
Billable utilisation. For professional services firms: billable hours as a percentage of total available hours per team member. Targets vary by role — consultants: 65–75%, managers: 50–60%, principals: 30–40%. The dashboard shows actual versus target.
Project margin. Revenue per project minus the fully-loaded cost of hours delivered. This shows which projects are profitable and which are eroding margin. For construction and consulting firms, this is the core profitability metric.
Task completion rate. Percentage of tasks completed on time versus overdue, by team and by project. Consistent overdue tasks signal scope creep, poor estimation, or resource constraints — all of which need different responses.
Capacity forecast. Committed hours for the next 2–4 weeks versus available capacity. Shows whether you can take on new work or need to hire or subcontract.
How to set these up
Zoho Analytics' drag-and-drop interface handles most of these dashboards without code. The process:
- Connect data sources. Link Zoho CRM, Books, Inventory, Desk, and Projects — all one-click native connections. For external platforms (Shopify, Amazon, WooCommerce), connect via the built-in eCommerce connectors or API.
- Define relationships. Map how data tables connect (CRM Contacts → Books Invoices → Desk Tickets). Zoho auto-detects most relationships; complex cross-source joins may need manual configuration.
- Build widgets. Drag fields onto chart builders. Choose visualisation type — line chart for trends, bar chart for comparisons, KPI widget for single numbers.
- Set refresh schedule. Data syncs hourly or daily depending on the source. Real-time dashboards are available for CRM data.
- Share and embed. Dashboard links for team members, scheduled email reports for leadership, embedded views for client portals.
For complex cross-source queries — like calculating project profitability by combining Projects time data with Books revenue and CRM deal data — you'll need calculated fields or SQL queries. Zoho provides a formula editor and a SQL query mode that experienced analysts can use directly. Our implementation team handles this during setup so you don't need to become a BI developer to get the dashboards you need.
Three mistakes that kill most Zoho Analytics implementations
1. Too many dashboards. The goal isn't to visualise every data point you have. It's to answer the 5–10 questions that drive your most important decisions. Every chart on a dashboard should prompt an action: investigate, adjust, celebrate, or escalate. If you're scrolling past charts, those charts shouldn't be there. A dashboard that requires a scroll to see all its widgets is a dashboard that nobody finishes reading.
2. Wrong data model. The most common technical mistake is building dashboards before properly mapping the data relationships between apps. If your CRM Contacts aren't linked to your Books Customers with a shared identifier (email or account ID), cross-source metrics like "revenue per customer segment" produce garbage. This step takes 1–2 hours to get right and saves weeks of confusion later.
3. No owner. Dashboards go stale when nobody is accountable for reviewing them. Assign each dashboard to one person whose weekly or monthly decision it directly supports. If the revenue dashboard isn't someone's job to act on, it becomes decoration.
Start with the 5 dashboards above. Add more only when a specific, recurring decision needs data you don't currently have.
For eCommerce teams who need specific KPI calculations — CAC by channel, LTV by cohort, COGS%, and contribution margin — rather than the general dashboard setup, the Zoho Analytics eCommerce reporting guide covers the data model joins, formula logic, and dashboard tiles that translate Zoho Finance data into unit economics.
Who configures this for you
Zolify has completed 100+ Zoho Analytics implementations across eCommerce, professional services, and distribution. Our team includes a Chartered Accountant on staff, which means the financial dashboards — AR aging, margin trends, cash flow forecasts — are built with accountant-level precision, not just BI logic. We're an Official Zoho Finance Partner, so implementations come with Zoho's direct support channel and priority onboarding.
Most analytics setups take 2–3 weeks from first call to live dashboards. The typical engagement:
- Week 1: Discovery. We map the 5–10 questions that drive your key decisions, audit existing data sources, and confirm the integration points (which Zoho apps are live, which external platforms need connecting).
- Week 2: Build. Data model configuration, calculated field definitions, dashboard layouts. We present a first draft at the end of week two.
- Week 3: Refine and train. Adjustments based on your feedback, owner assignment for each dashboard, and a 60-minute training session for the team that will use them daily.
After handoff, dashboards run automatically. Data refreshes on the schedule you set. When your business changes — new product line, new platform, new metric you care about — adding a new dashboard takes hours, not weeks.
Book a free consultation and we'll scope the analytics setup that fits your business.
Frequently Asked Questions
Yes. Zoho Analytics has native connectors to Zoho CRM, Books, Inventory, Desk, Projects, Campaigns, and most other Zoho apps. Data syncs automatically on a schedule you define — hourly, daily, or real-time for CRM data. It also connects to external sources like Google Sheets, Shopify, Amazon Seller Central, WooCommerce, and third-party apps via API or Zapier.
Zoho Analytics Basic starts at $24/month (billed annually) for 2 users with 0.5 million data rows. Standard is $48/month for 5 users with 1 million rows. Premium is $115/month for 15 users with 5 million rows. Enterprise is $455/month for 50 users with 50 million rows. All plans include unlimited viewers. Zoho Analytics is also bundled in Zoho One at $45/user/month (billed annually), which includes 45+ Zoho applications.
Yes. Zoho Analytics supports public embed links, password-protected sharing, and embedded dashboards in websites or client portals. You can also schedule automated PDF or email reports to anyone — no Zoho license required on the recipient's end. This is useful for sharing executive dashboards with investors or operational reports with 3PL partners.
No for basic dashboards — the drag-and-drop interface handles standard charts, tables, and KPI widgets without any coding. Moderate SQL knowledge helps for complex cross-source queries and calculated fields. For most eCommerce reporting needs (channel P&L, inventory turns, AR aging), Zoho's formula language covers the calculations. Complex data transformations, like joining Shopify order data with Zoho Books COGS, are where an implementation partner adds value.
Zoho CRM and Zoho Books each have solid built-in reports for their own data. Zoho Analytics goes further by combining data across all sources — CRM, Books, Inventory, Desk, Projects, and external platforms — into a single unified view. If you need to see sales pipeline health alongside AR aging and inventory stock levels in one dashboard, that's what Analytics is designed for. It also supports much deeper customisation, calculated metrics, and scheduled distribution.
See exactly where your Shopify, Amazon, or WooCommerce ops are leaking — free.
Get a personalised eCommerce Ops Audit: inventory gaps, accounting leaks, and order-flow bottlenecks — with a Zoho fix roadmap. Delivered in 48 hours, at no cost.